My Typical Data Analysis Workflow
From Data Warehouse to Final Reporting A professional guide to the SQL → Python → Power BI pipeline
DATA ANALYTICS BLOG POSTS
Boniface Kipchumba Mibei
4/21/20264 min read

Introduction
Most organisations today store their data in modern cloud data warehouses such as Snowflake and Google BigQuery. These platforms are engineered for scale — capable of processing billions of rows with remarkable speed and cost-efficiency. For data analysts who work across SQL, Python, and Power BI, understanding how these tools interact is essential to building a reliable, professional-grade analytical workflow.
This article describes my typical end-to-end data analysis pipeline: from querying raw data in a warehouse, through exploratory analysis in Python, to delivering polished visualisations in Power BI. This is a widely adopted, industry-standard approach, and for good reason.
The Pipeline at a Glance
The core workflow follows three sequential stages:
SQL (Data Warehouse) → Python (EDA) → Power BI (Visualisation)
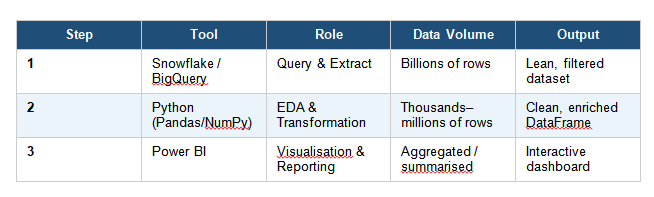
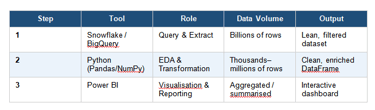
The table below summarises what happens at each stage:
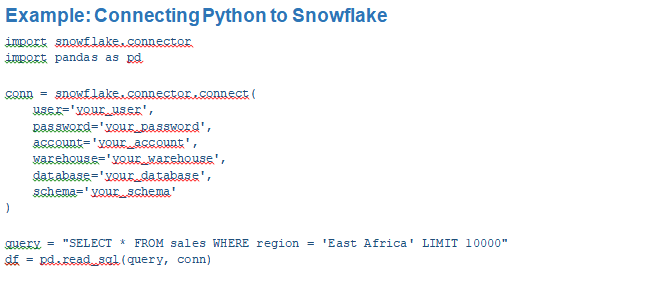
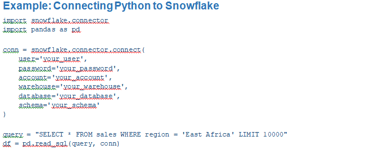
Stage 1 — SQL: Querying the Data Warehouse
The first step is always to query data directly in the warehouse using SQL. Platforms like Snowflake and Google BigQuery are purpose-built for heavy analytical workloads. Doing the heavy lifting at this stage is a deliberate and strategic choice:
• They use columnar storage and distributed compute to handle large datasets efficiently.
• Filtering and aggregating in SQL means Python and Power BI receive a lean, focused dataset — not a raw dump.
• In BigQuery specifically, you are billed per bytes scanned — a well-written SQL query directly reduces cost.
• SQL enables clean joins across multiple tables before data ever leaves the warehouse.
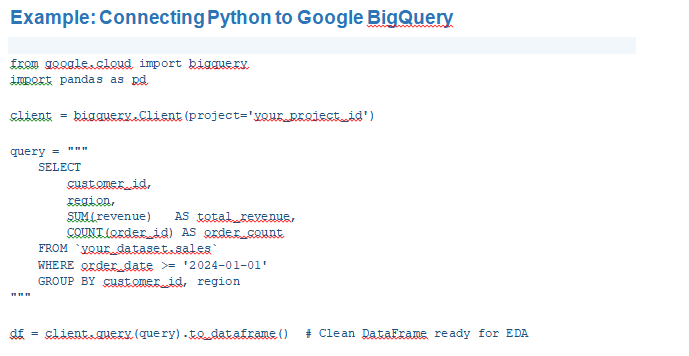
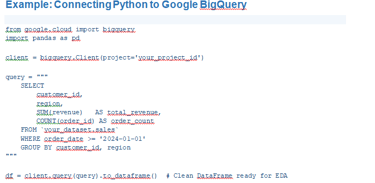
Stage 2 — Python: Exploratory Data Analysis
Once a clean, filtered dataset is in hand, Python becomes the primary tool for exploratory data analysis (EDA) and deeper investigation. SQL is excellent for retrieval and aggregation, but it is not designed for statistical reasoning or iterative exploration. Python fills this gap:
• Libraries such as Pandas, NumPy, Matplotlib, Seaborn, and Plotly give far more analytical flexibility than SQL.
• Statistical tests, correlation matrices, and outlier detection are straightforward in Python.
• Feature engineering and data transformations can be performed programmatically and reproducibly.
• Jupyter Notebooks allow for rapid iteration, inline visualisation, and documentation of findings.
The key discipline at this stage is to avoid loading unnecessary data. Because the SQL query was precise and targeted, Python works with a dataset that is already fit for purpose — making analysis faster and less error-prone.
Stage 3 — Power BI: Visualisation and Reporting
The final stage is delivering insights to stakeholders through Power BI. Business decision-makers need interactive, self-service dashboards — not Python scripts or raw data tables. Power BI is the right tool for this job for several reasons:
• It is purpose-built for business intelligence and interactive reporting.
• It connects natively to both Snowflake and BigQuery, without requiring Python as an intermediary.
• Power Query handles light data transformations, reducing reliance on Python for simple reshaping tasks.
• Dashboards can be scheduled to refresh automatically from the data warehouse.
A Note on Direct Connections
An important practical consideration: Power BI does not always need to go through Python. Because it connects directly to Snowflake and BigQuery, the pipeline can branch into two parallel tracks:
• SQL → Python — for deep statistical analysis, machine learning, or complex transformations.
• SQL → Power BI — for routine dashboards and scheduled reports, refreshed directly from the warehouse.
Python is only introduced in the Power BI path when data requires transformation that Power Query alone cannot handle cleanly.
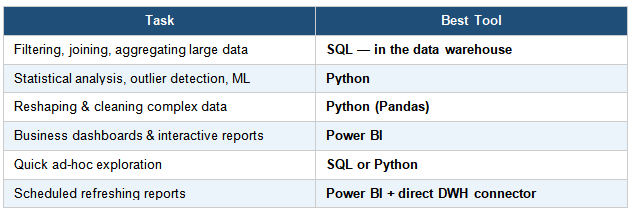
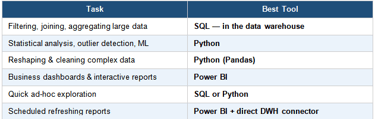
When to Use Each Tool
Knowing which tool to reach for at each stage prevents duplication of effort and keeps the pipeline efficient:
Potential Weak Points and How to Address Them
No pipeline is without its trade-offs. The main risk in this workflow is manual data transfer — querying in SQL, analysing in Python, then manually loading results into Power BI. This approach can become brittle in a production environment. Two solutions address this:
• Write transformed data back to the warehouse after Python processing, then connect Power BI directly to the resulting table. This keeps everything auditable and refreshable.
• Use transformation tools such as dbt (data build tool) to manage data transformations inside the warehouse itself, reducing Python’s role to pure analysis rather than data preparation.
The golden rule of this pipeline is: filter aggressively in SQL so that every downstream tool — Python and Power BI — works with lean, purposeful data, not raw dumps.
Conclusion
The SQL → Python → Power BI pipeline is not just viable — it is a professional, scalable, and highly marketable approach to data analysis in the modern cloud environment. Each tool plays to its strengths: SQL for precise extraction from massive datasets, Python for rigorous analysis and transformation, and Power BI for communicating insights to business stakeholders.
Mastering this workflow positions any data analyst to operate effectively in environments that rely on Snowflake, Google BigQuery, or other cloud-native data warehouses — which increasingly means most modern organisations.
By:
Boniface Mibei | Boniface@bkdataanalytics.com