Outliers in Python Dataframe (Dataset Column)
This data analytics blog post talks about detecting and treating outliers in a dataset column using Python, a powerful data cleaning step.
DATA ANALYTICS BLOG POSTS
Boniface Mibei
4/2/20261 min read
Outliers are extreme values in a column, dataframe, or a dataset that can bring a false impression when statistics such are mean are calculated. As such, it is important to treat them before doing any meaningful analysis in Python.
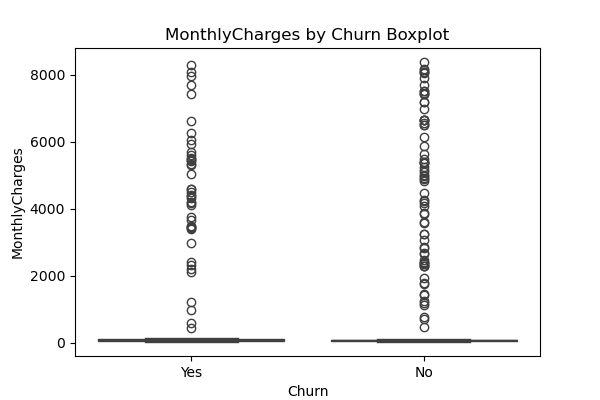
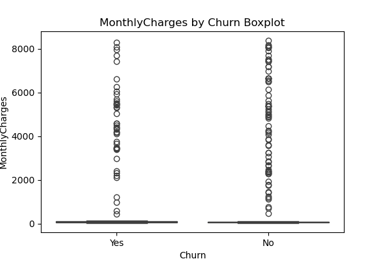
We will use the imaginary column named 'MonthlyCharges' in our examples.
To begin with, how do you know that there are outliers? You do so by plotting the data in a boxplot. Although the chart may not show the individual values, it maps out how data is distributed, including the minimum, maximum, Q1 (first quartile), Q2 (second quartile/mean), and Q3 (third quartile) values. The dotted values beyond the whiskers are known as outliers. You can then find those exact values by running the python code df[‘MonthlyCharges’].describe(). Understanding and treating them accordingly is an essential step in data cleaning.
How do find the exact outlier values in the column? You do so by performing a number of calculations. First, you find the Interquartile Range (IQR): done by subtracting first quartile (Q1) from the third quartile (Q3). It is the difference between the upper and lower quartiles.
Interquatile Range (IQR) = Q3 – Q1
Now, the lower and upper bounds of the dataset can be found using the following formulae:
Lower_bound = Q1 – IQR*1.5
Upper_bound = Q3 + IQR*1.5
Now, you have the acceptable limits beyond which the data are outliers.
col = df[‘MonthlyCharges’]
outliers = (col < Lower_bound) | (col > Upper_bound)
How you treat them depends on context. You can: remove them, convert them to NaN, fill them with mean, mode, median, or a specific fixed value such as zero(0). In this case, let’s assume we are converting them to NaN:
pd.loc[(col <=Lowerb) | (col >= Upperb), ‘MonthlyCharges’] = np.nan
Any number below the lower_bound can be filled with the value of the lower bound, and any number above the upper_bound can be filled with the value of the upper bound, depending on the context.
This way, you will have identified and treated the outliers in a column in python dataframe, which is one way of data cleaning.
By:
Boniface Mibei | boniface@bkdataanalytics.com